
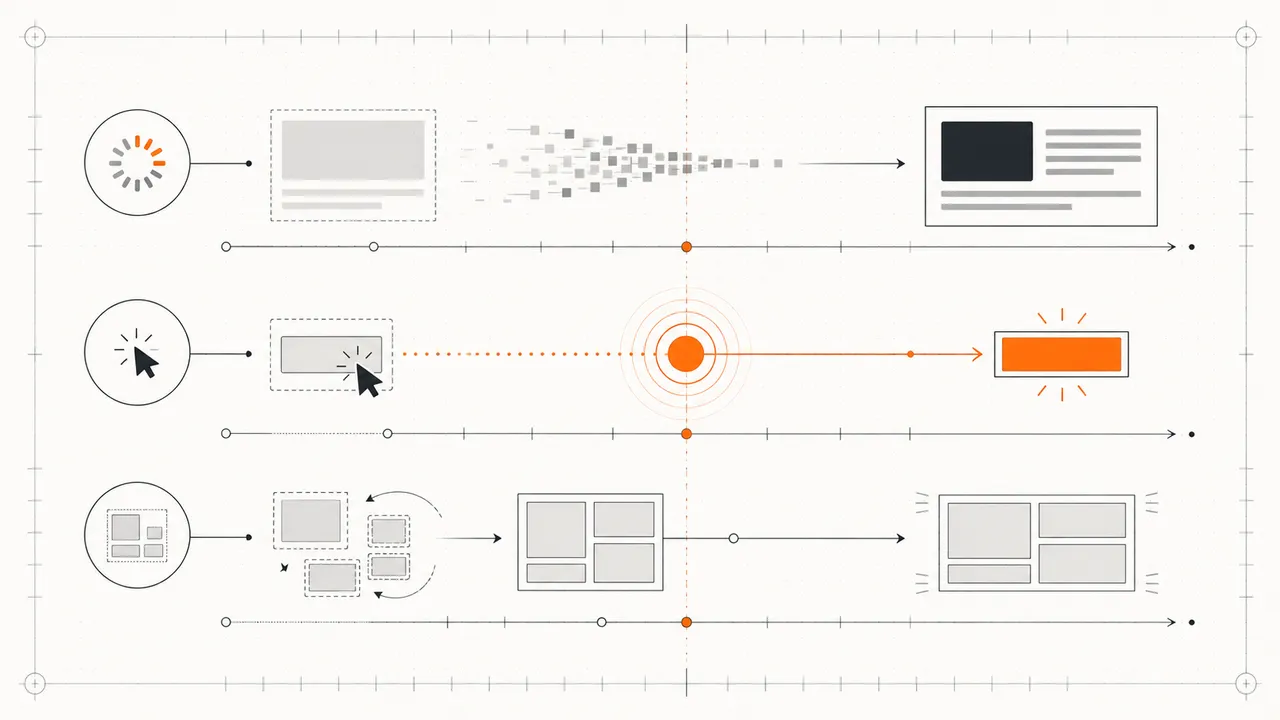
What Core Web Vitals are
Core Web Vitals are the metrics Google uses to assess key parts of a page’s real-world user experience. They cover three things people notice directly: how quickly the main content appears, how quickly the page responds to an interaction, and how stable the layout remains while loading.
- LCP (Largest Contentful Paint) measures how quickly the main content appears. The good threshold is 2.5 seconds or less.
- INP (Interaction to Next Paint) measures how quickly the page responds to a click, tap, or key press. The good threshold is 200 milliseconds or less.
- CLS (Cumulative Layout Shift) measures unexpected movement of visible content. The good threshold is 0.1 or less.
Each metric is evaluated at the 75th percentile of real visits and reported separately for mobile and desktop. Put plainly, at least 75% of visits should receive an experience within the “good” threshold.
The set can change as web usage changes. In March 2024, INP replaced First Input Delay (FID), because FID measured only the first interaction and missed sluggishness later in a visit.
How Core Web Vitals affect SEO
Core Web Vitals are among the page-experience signals used by Google’s core ranking systems, but they are not the only factor. Content that best answers the searcher’s need remains more important, and passing all three metrics does not guarantee a top position.
The useful goal is not a perfect score for SEO alone. It is to remove problems people can feel: waiting too long for the main content, pressing a control that appears stuck, or having content jump and cause a wrong click. See Google Search Central’s page-experience guidance for the current qualification.
What LCP, INP, and CLS measure
LCP — Largest Contentful Paint
LCP measures the time from the start of a page load until the largest image or text block in the initial viewport has been painted. The qualifying element is often the main image, a video’s first frame, a background image loaded through CSS, or a large text block. It answers one question: when did the visitor see the content they came for?
Where LCP time goes
LCP breaks into four consecutive parts: time to first byte (TTFB), the delay before the browser starts loading the LCP resource, the resource load duration, and the delay before the final paint. The breakdown matters more than the total alone because each part requires a different fix.
For example, a long resource-load delay may mean that the main image is discovered only after JavaScript runs or through CSS. A long resource duration points instead to file size, server response, or network conditions.
INP — Interaction to Next Paint
INP measures responsiveness across the whole visit. It observes clicks, taps, and key presses, then reports a value close to the slowest interaction of that visit. The time begins when the visitor acts and ends at the next frame that shows the result. Scrolling and hovering are not included.
A high INP often means the main thread is blocked by a long JavaScript task, an event handler performs too much work, or the browser must recalculate a large amount of style and layout before it can paint.
CLS — Cumulative Layout Shift
CLS is a unitless score based on the area of the viewport that moved and the distance it moved, with adjacent shifts grouped into windows. Shifts within 500 milliseconds of certain user interactions are excluded because the visitor initiated the change.
Common causes include images or iframes without dimensions, an ad slot inserted above existing content, a web font that occupies different space from its fallback, or a component that pushes the page down when it finishes loading.
Core Web Vitals thresholds
| Metric | Good | Needs improvement | Poor |
|---|---|---|---|
| LCP | ≤ 2.5 seconds | over 2.5 to 4.0 seconds | over 4.0 seconds |
| INP | ≤ 200 milliseconds | over 200 to 500 milliseconds | over 500 milliseconds |
| CLS | ≤ 0.1 | over 0.1 to 0.25 | over 0.25 |
- LCPLargest Contentful PaintWhen does the main content appear?Good≤ 2.5 secondsNeeds improvement2.5 – 4.0 secondsPoor> 4.0 seconds
- INPInteraction to Next PaintHow fast does the page answer a tap?Good≤ 200 millisecondsNeeds improvement200 – 500 millisecondsPoor> 500 milliseconds
- CLSCumulative Layout ShiftHow much does content move on its own?Good≤ 0.1Needs improvement0.1 – 0.25Poor> 0.25
A page passes Core Web Vitals only when all three metrics pass. If one misses its threshold, the page does not pass overall. The methodology is documented in How the Core Web Vitals thresholds were defined on web.dev.
How to measure Core Web Vitals correctly
Field data assesses real experience. Lab data helps reproduce and diagnose a cause. They answer different questions and should not be substituted for each other.
Start with field data
Field data comes from real visitors, so it includes a range of devices, networks, locations, and usage patterns. Useful sources include:
- PageSpeed Insights, whose upper section shows Chrome UX Report (CrUX) data for the URL or origin when enough data is available.
- The Core Web Vitals report in Google Search Console, which groups URLs with similar problems.
- Your own Real User Monitoring (RUM), when you need route or interaction detail that CrUX does not expose.
CrUX summarizes a rolling 28-day period, so it does not change immediately after a deployment. A low-traffic URL may also lack page-level data. Always check whether the number shown belongs to that URL or is an origin-level fallback.
Use lab data to find the cause
Lab data is measured in a controlled environment with Lighthouse or the Performance panel in DevTools. It is repeatable, useful for before-and-after comparisons, and can expose work on the main thread, but it does not represent every visitor.
Lighthouse can measure LCP and CLS during a simulated load, but it cannot measure INP directly because there is no real user interaction. It reports Total Blocking Time (TBT) as a related diagnostic, not as a one-to-one substitute for INP.
Run Lighthouse from the command line with:
npx lighthouse https://example.com --only-categories=performance --viewTo collect metrics from real visits, the web-vitals library can read the browser APIs and send each value to your analytics endpoint.
import { onCLS, onINP, onLCP, type Metric } from 'web-vitals';

function report(metric: Metric) {
	const body = JSON.stringify({
		name: metric.name,
		value: metric.value,
		rating: metric.rating,
		path: location.pathname,
	});
	navigator.sendBeacon('/rum', body);
}

onLCP(report);
onINP(report);
onCLS(report);
A practical Core Web Vitals workflow
- Confirm the issue in real visits. Read field data separately for mobile and desktop, and check whether it is URL-level or origin-level data.
- Identify the failing metric. Do not optimize everything at once. Start with the LCP, INP, or CLS issue with the greatest user impact.
- Reproduce it in the lab. Match the devices and network conditions of the affected audience, then capture a trace that identifies the element, task, or layout shift responsible.
- Fix the cause and prevent regression. Compare before and after, add a performance budget or automated check, and wait for the next field-data window to confirm the outcome.
Fixes that usually help
Improve LCP
- Identify the element that is actually the page’s LCP and make it discoverable in the initial HTML response.
- Give the main image
fetchpriority="high"when appropriate, and avoid loading the LCP image through JavaScript or as a CSS background where possible. - Do not put
loading="lazy"on an image in the initial viewport; it delays a request that should start early. - Reduce TTFB and move render-blocking CSS or scripts off the critical path.
See Optimize Largest Contentful Paint on web.dev for a diagnostic breakdown by LCP subpart.
Improve INP
- Find slow interactions through RUM or the Performance panel instead of inferring them from bundle size alone.
- Break JavaScript tasks longer than 50 milliseconds into smaller pieces and yield so the browser can paint between them.
- Reduce work inside event handlers and defer anything not required for immediate visual feedback.
- Avoid layout thrashing caused by repeatedly alternating layout reads and writes in one task.
Improve CLS
- Set
widthandheight, oraspect-ratio, on images, videos, and iframes. - Reserve space for banners, embeds, ad slots, and components that arrive later.
- Load fonts deliberately and tune fallback metrics to match the final font.
- Avoid inserting content above what the visitor is reading unless the change follows their action and space is already reserved.
Frequently asked questions
Must LCP, INP, and CLS all pass?
Yes. All three must meet the good threshold for a page to pass Core Web Vitals. Each metric is assessed at the 75th percentile and reported separately for mobile and desktop.
Does a Lighthouse score of 100 mean Core Web Vitals pass?
Not necessarily. Lighthouse is a lab test at one point in time. The real-experience assessment comes from a 28-day field-data window, and Lighthouse does not measure INP directly.
Will better Core Web Vitals improve Google rankings immediately?
There is no guarantee. Core Web Vitals are one part of page experience, while ranking systems also consider relevance, quality, and usefulness. Fix user-facing problems first, then monitor organic-search outcomes alongside the performance data.
Further reading and sources
- Page experience in Google Search
- Core Web Vitals thresholds and the 75th percentile
- How to diagnose and improve LCP
- Why lab and field data differ
If you need to assess site speed alongside technical structure, content, and page discoverability, see the SEO consulting service or browse all Nixxel articles.